

Winegrape similarities and concentrations: A description Original language of the article: English.

The aim of this article is to describe the mixes of winegrape varieties in the world’s main wine-producing countries. In doing so, we summarise a recent scientific journal article (Puga and Anderson 2023), in which we used data on area by variety for virtually all wine-producing countries and did some statistical analyses based on two indexes that we computed with those data. One of these indexes measures varietal similarities between countries, and the other measures varietal concentration within countries.
Figure 1 shows the similarities in the varietal mixes of the top 20 countries by vineyard area, based on the varietal similarity index (see Anderson (2010
Figure 1. Dendrogram for the top 20 countries by winegrape area, based on their varietal similarities.
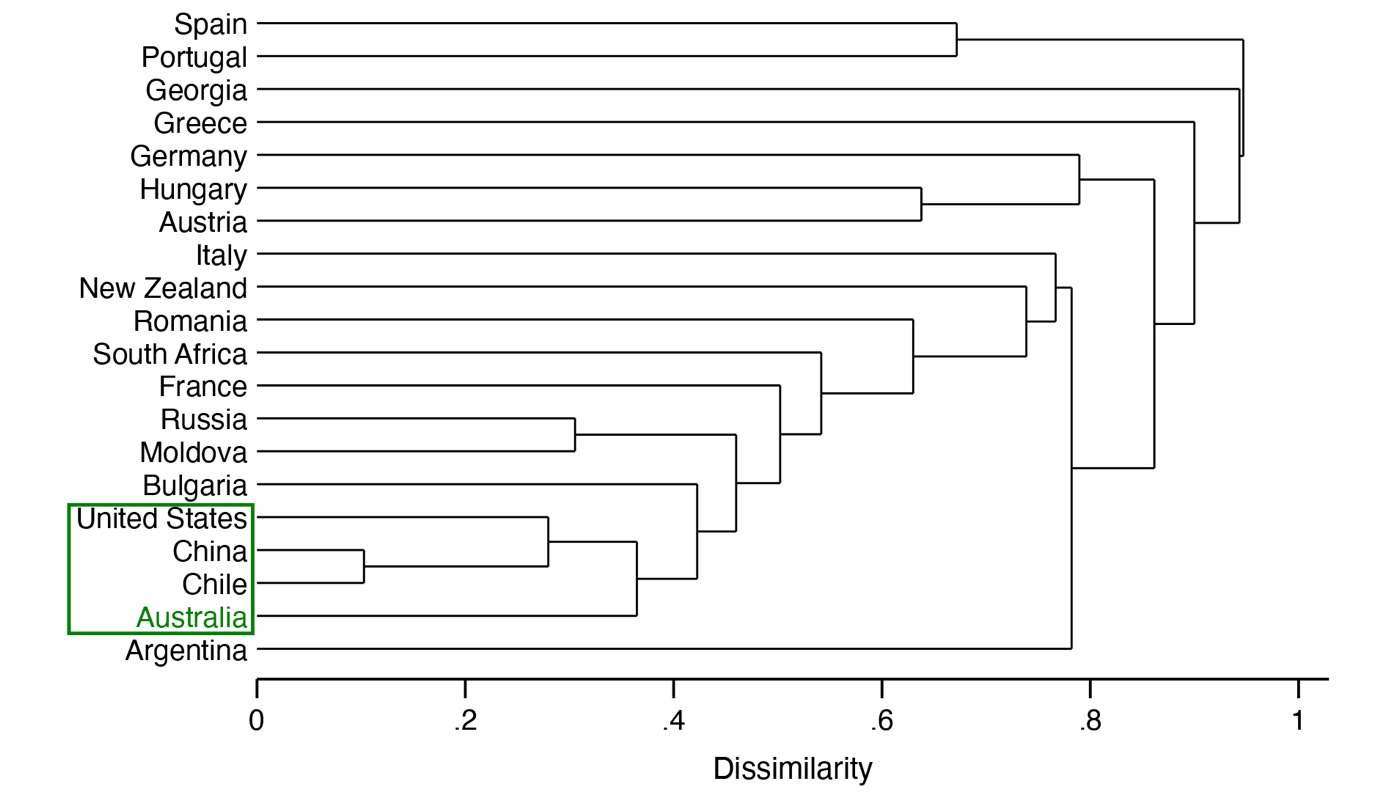
For example, if we look at Australia, it has a varietal mix very similar to that of Chile and the United States. To a lesser extent, Australia also has a mix similar to a group of countries that includes France, South Africa, and New Zealand. But its mix of winegrape varieties is quite different to those of Argentina and the European countries that are in the top part of this figure, such as Spain, Portugal, Germany, and Italy.
The other index is the varietal concentration index, which has a very straightforward interpretation. It answers the question: If two vineyard plots are randomly chosen in a country, what is the probability that they will have the same variety? For some countries it is quite low and for others quite high. Italy has the lowest varietal concentration index (3 %). New Zealand has one of the highest (37 %), mainly because it is very concentrated in Sauvignon Blanc in Marlborough.
Figure 2 shows a classification of countries based on how similar their varietal mixes are with respect to the world as a whole and how concentrated their mixes are. There are three groups of countries.
Figure 2. Groups of countries based on how similar their varietal mixes are with respect to the world as a whole and how concentrated their mixes are.
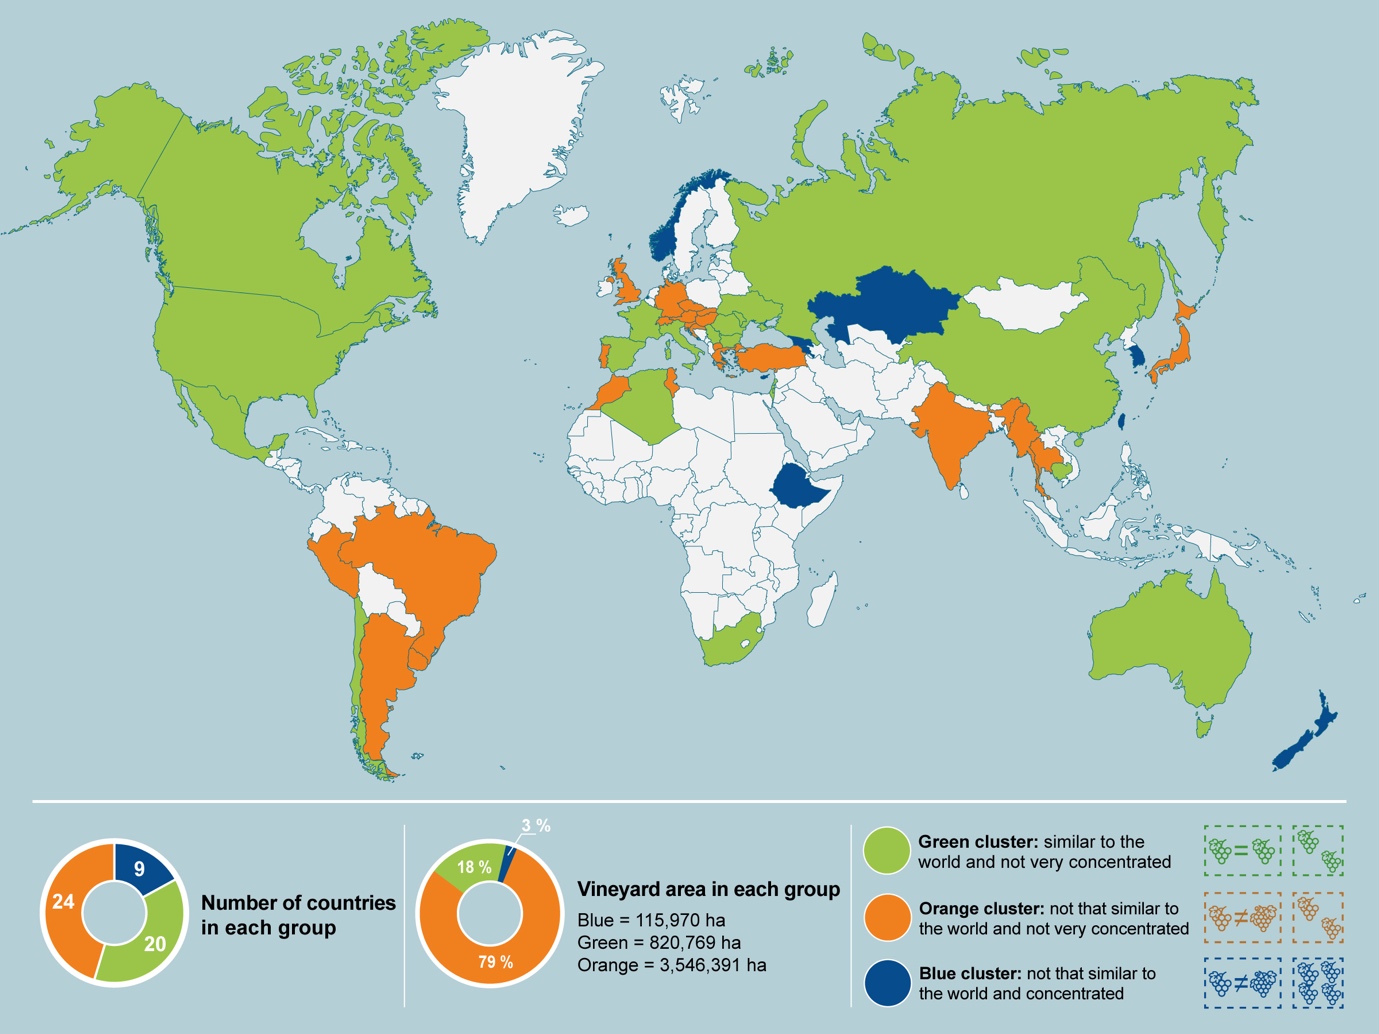
The most important group of countries is the green one because four-fifths of the world’s winegrape area belongs this group. These countries have a mix of winegrape varieties that is very similar to the one of the world and are not very concentrated. This group includes Australia, the US, Spain, France, Italy, Chile, and South Africa.
The orange group includes countries that are not very concentrated and have a varietal mix that is quite distinct to that of the world. Argentina, Portugal, and Germany are part of this group.
Last, the blue group includes countries that have a varietal mix that is quite different to the world’s and are very concentrated in a few varieties. New Zealand and Georgia are probably the best examples.
We also used our two indexes for answering the question: Are countries becoming more or less similar and more or less concentrated over time? What we can see based on these indexes is that the varietal mixes are becoming more similar across countries and with respect to the world as a whole, and that these mixes are more concentrated within countries and globally.
The implications of these changes are discussed in a subsequent article in this series. Most of the data used in Puga and Anderson (2023)
Acknowledgements: The authors are grateful for financial support from Wine Australia, under Research Project UA1803-3-1, and from the University of Adelaide’s School of Agriculture, Food and Wine and its Faculty of Arts, Business, Law and Economics.

Notes
- 1. Anderson K. (2010). Varietal intensities and similarities of the world’s wine regions. Journal of Wine Economics, 5, 270–309. DOI: 10.1017/ S193143610000095X
- 2. Puga, G., & Anderson, K. (2023). Concentrations and Similarities across Countries in the Mix of Winegrape Cultivars. American Journal of Enology and Viticulture, 74(1). https://doi.org/10.5344/ajev.2023.22067
- 3. Anderson, K., & Nelgen, S. (2020a). Database of Regional, National and Global Winegrape Bearing Areas by Variety, 1960 and 2016. Wine Economics Research Centre, University of Adelaide. (First version by K. Anderson and N.R. Aryal, 2013, revised 2014.) https://economics.adelaide.edu.au/wine-economics/databases#database-of-regional-national-and-global-winegrape-bearing-areas-by-variety-1960-to-2016
- 4. Anderson, K., & Nelgen, S. (2020b). Which Winegrape Varieties are Grown Where? A Global Empirical Picture (revised ed.). University of Adelaide Press.
- 5. Puga, G., & Anderson, K. (2023). Concentrations and Similarities across Countries in the Mix of Winegrape Cultivars. American Journal of Enology and Viticulture, 74(1). https://doi.org/10.5344/ajev.2023.22067
- 6. Anderson, K., & Nelgen, S. (2020a). Database of Regional, National and Global Winegrape Bearing Areas by Variety, 1960 and 2016. Wine Economics Research Centre, University of Adelaide. (First version by K. Anderson and N.R. Aryal, 2013, revised 2014.) https://economics.adelaide.edu.au/wine-economics/databases#database-of-regional-national-and-global-winegrape-bearing-areas-by-variety-1960-to-2016
- 7. Anderson, K., & Nelgen, S. (2020b). Which Winegrape Varieties are Grown Where? A Global Empirical Picture (revised ed.). University of Adelaide Press.
- 8. Puga, G., & Anderson, K. (2023). Concentrations and Similarities across Countries in the Mix of Winegrape Cultivars. American Journal of Enology and Viticulture, 74(1). https://doi.org/10.5344/ajev.2023.22067
References
- Puga, G., & Anderson, K. (2023). Concentrations and Similarities across Countries in the Mix of Winegrape Cultivars. American Journal of Enology and Viticulture, 74(1). https://doi.org/10.5344/ajev.2023.22067
- Anderson K. (2010). Varietal intensities and similarities of the world’s wine regions. Journal of Wine Economics, 5, 270–309. https://doi.org/10.1017/ S193143610000095X
- Anderson, K., & Nelgen, S. (2020a). Database of Regional, National and Global Winegrape Bearing Areas by Variety, 1960 and 2016. Wine Economics Research Centre, University of Adelaide. (First version by K. Anderson and N.R. Aryal, 2013, revised 2014.) https://economics.adelaide.edu.au/wine-economics/databases#database-of-regional-national-and-global-winegrape-bearing-areas-by-variety-1960-to-2016
- Anderson, K., & Nelgen, S. (2020b). Which Winegrape Varieties are Grown Where? A Global Empirical Picture (revised ed.). University of Adelaide Press.
Article statistics
 Views: 4609
Downloads
 XML: 206